Delivery ETA Benchmarking for
Food Delivery Leaders

Operations teams require accurate Delivery ETA Benchmarking to understand baseline advertised delivery times across competing platforms. This continuous intelligence allows you to calibrate regional dispatch strategies and surface speed gaps before they impact market share.

Trusted by Fortune 500.

Get real-time data from all food platforms.

Without this data

Your team operates on outdated speed assumptions

Relying on anecdotal field reports leaves your regional managers guessing about true competitor speed. Inaccurate baseline data distorts dispatch planning and quietly erodes local market dominance.

Strategic
Misaligned local market positioning
Operating without structural speed data means leadership allocates rider incentives blindly across zones. Annual budgets fund defensive moves in neighborhoods where you already lead on delivery times.
Operational
Manual tracking wastes weekly cycles
Operations analysts spend dozens of hours every week checking advertised delivery times on rival apps by hand. Regional planners manually rebuild fragmented speed sheets in Excel instead of optimizing actual courier shifts.
Business
Higher customer churn to faster apps
Diners open multiple apps and default to the platform advertising the shortest wait time for their preferred meal. Slow apparent ETAs silently drain transaction volume and lower long-term customer lifetime value.
Intelligence
Delayed executive response to speed drops
Leadership only discovers competitive speed disadvantages during quarterly business reviews after the GMV damage is done. The board lacks real-time comparative metrics to evaluate the success of new operational rollouts.
Sample signal

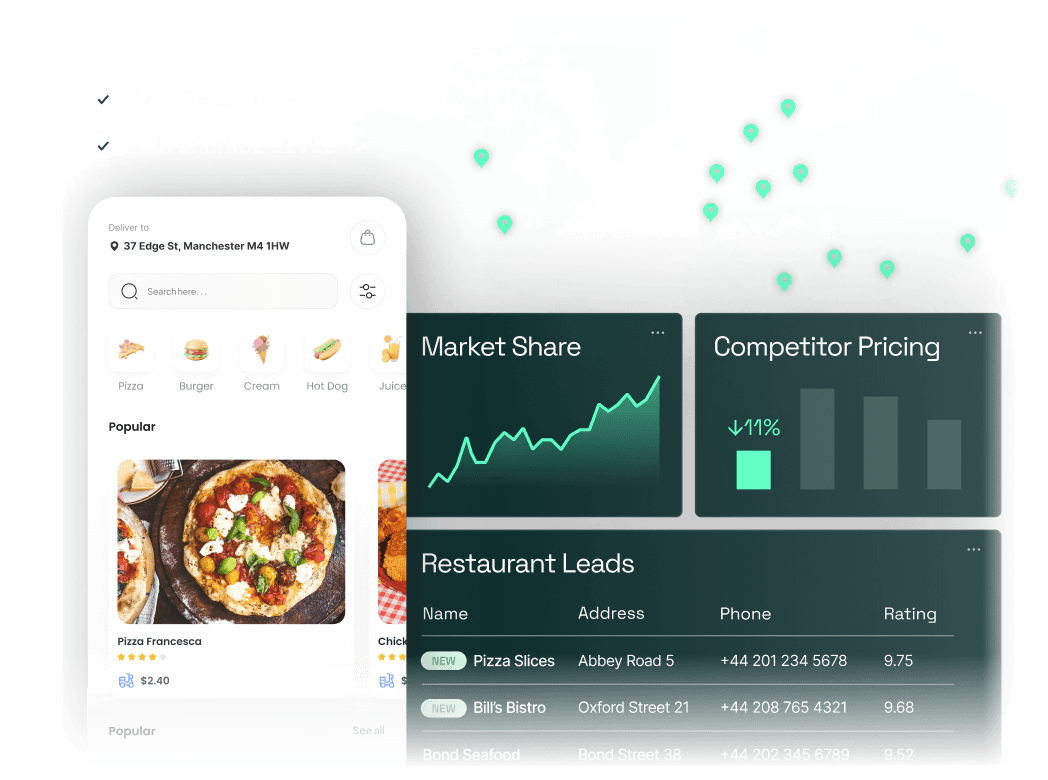
What a delivery ETA record looks like

Every row provides normalized, publicly advertised delivery time estimates captured directly from venue listings. Teams instantly consume structured speed metrics mapped geographically without touching underlying infrastructure.

Venue Name Platform Store Rating Postcode Advertised ETA Market Pos. Last Capture
Shake Shack Uber Eats 4.8 / 5 10014 20-30 min Leading today 11:32
Sweetgreen DoorDash 4.2 / 5 94107 45-60 min Lagging today 11:15
Nando's PERi-PERi Deliveroo 4.6 / 5 E1 6AN 25-35 min At Par yesterday
Chipotle Mexican Grill Grubhub 3.9 / 5 60614 30-45 min Monitoring 2 days ago
Five Guys Glovo 4.9 / 5 28004 15-25 min Leading today 09:45
Speak to an Analyst
→ Request free PoC
What you get

Your team unlocks unified speed intelligence

FoodDataLab captures and normalizes advertised delivery estimates across competing platforms. Operations and strategy teams consume this data directly in their preferred BI tools to drive immediate workflow improvements.

40+ cities
Tracked daily
Monitor advertised wait times across major urban markets continuously.
15+ apps
Matched venues
Compare speed estimates accurately across shared restaurant partners.
<24h
Refresh cadence
Identify sudden ETA spikes or service slowdowns within a single day.
98%
Mapping success
Connect venue aliases reliably to track exact local speed baselines.

What food delivery providers want to understand with data

0:00
Double Data Logo

FoodDataLab use cases across food delivery departments

0:00
Double Data Logo

Why in-house food delivery data scraping costs more than you think

0:00
Double Data Logo

How our data serves pricing and marketing teams worldwide

0:00
Double Data Logo

Why comparing food delivery platform pricing is so hard?

0:00
Double Data Logo
Business impact

Transform advertised speed data into market dominance

Deploying accurate ETA intelligence directly impacts user conversion and regional competitiveness. VPs of Operations shift from reactive troubleshooting to proactive market capture.

Seize slow competitor zones
Exploit rival service degradation by immediately boosting marketing spend in affected postcodes. You capture disgruntled diners while competitors struggle to balance local courier supply.
Defend core neighborhood GMV
Identify when competing apps aggressively drop advertised times for key restaurant partners. You dynamically adjust courier positioning to match local speed and retain your transaction volume.
Win multi-tenant chain orders
Track comparative delivery speeds for major quick service brands operating on multiple apps. You take the lion's share of high-intent orders by consistently displaying the fastest delivery.
Speak to an Analyst
→ Request free PoC
How it works

From raw speed signal to strategic advantage in 3 steps

FoodDataLab operates a robust pipeline that continuously captures publicly advertised data and delivers it straight to your existing reporting stack. You avoid expensive internal engineering builds and start analyzing competitor operations immediately.

1

Capture

Our infrastructure tracks publicly visible ETA figures displayed on Uber Eats, Glovo, and DoorDash without bypassing authentication barriers. This establishes a continuously updated baseline of competitor speed across thousands of local restaurant listings.
2

Normalize

We map fragmented restaurant profiles across competing apps to ensure exact apples-to-apples comparisons. Advertised ETA ranges are converted into clean numerical data sets ready for immediate aggregate analysis.
3

Deliver

Structured intelligence flows seamlessly into your native tools via Metabase, Power BI, REST API, or scheduled database exports. Your regional operations analysts build automated alerts instead of wrestling with messy CSV files.
FAQ

Questions we get from operations leaders like you

Honest answers about our tracking capabilities, data structures, and delivery methods.

Start tracking your true competitive speed

Request a sample set of advertised ETA data mapped to a selection of your priority venues. Our intelligence engineers will walk you through the collection methodology and demonstrate how this signal integrates directly into your current BI stack.

  • A dedicated data expert assigned to your case
  • No obligation, free consultation
  • Full support from scoping to delivery

Need an NDA first? Just mention it in the form - we're happy to sign.

Logo

Get access to the only

market intelligence you need

© 2026 doubledata.com | All Rights Reserved

Made by mush studio