Average ETA vs. Distance Benchmarking for
Quick Commerce Leaders

Quick commerce operators must balance aggressive delivery promises against the geographic reality of their dark store networks. Average ETA vs. Distance Benchmarking maps competitor delivery speeds against coverage zones to reveal who truly owns convenience in every neighborhood.

Trusted by Fortune 500.

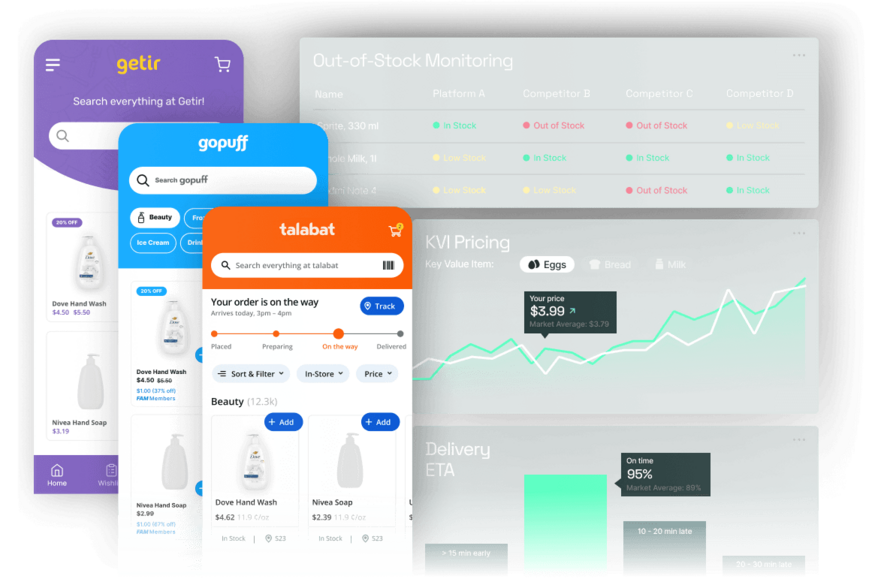
Get real-time data from all quick commerce platforms.

Without this data

Your team misjudges the true cost of local convenience

Relying on generic city-level estimates obscures how competitors actually manage neighborhood service levels. Teams fail to understand if rivals are optimizing local dispatch or simply overpromising on speed to capture share.

Strategic
Expansion planning lacks local precision
Strategy teams plot new locations without understanding how rival density impacts local service expectations. This results in building costly new hubs in zones where competitors already deliver faster from further away.
Operational
Manual mapping drains analyst hours
Data teams waste dozens of hours every week manually plotting rival store coordinates against advertised delivery times on spreadsheets. This tedious cross-referencing process forces staff to delay critical network analysis routines.
Business
Uncompetitive ETAs suppress order volume
Slower promised delivery times directly push local customers to open a competing app. Revenue drops when your dark store quotes twenty minutes while a rival promises fifteen for the exact same delivery radius.
Intelligence
Leadership reacts to outdated market maps
Executive teams review quarterly market share slides that completely miss sudden shifts in competitor service levels. Decisions about fleet scaling are delayed because accurate delivery performance benchmarks never reach the boardroom.
Sample signal

What an ETA vs. distance benchmarking record looks like

A localized snapshot detailing advertised delivery speeds correlated with mapped dark store catchments. Teams instantly see how aggressively competitors promise fulfillment within specific geographic radii.

Target Zone Operator Dark Store Distance Advertised ETA Efficiency Index Speed Posture Last Mapped
Islington, London Gopuff 450m 10-15 min 4.9 / 5 Aggressive today 14:12
Mitte, Berlin Flink 850m 15-20 min 4.6 / 5 Optimized today 09:30
Eixample, Barcelona Glovo Express 2100m 30-40 min 3.5 / 5 Lagging yesterday
Kreuzberg, Berlin Getir 1200m 20-30 min 3.9 / 5 Standard 2 days ago
Vesterbro, Copenhagen Wolt Market 650m 15-20 min 4.5 / 5 Optimized today 11:45
Speak to an Analyst
→ Request free PoC
What you get

Your team gains absolute clarity on geographic logistics

FoodDataLab continuously maps public delivery estimates against verified dark store infrastructure. Pricing and operations teams finally understand the exact spatial reality of the competitive landscape.

<24 hours
Update frequency
Track daily shifts in promised delivery speeds across targeted zones.
15+ cities
Markets profiled
Compare local service levels across leading rapid grocery operators.
500 meters
Radius precision
Analyze advertised delivery times mapped strictly against proximity.
4 formats
Delivery methods
Access granular geographic data via direct API or scheduled extracts.

Digital grocery runs on price, availability & visibility

0:00
Double Data Logo

Out of stock = leaving margin on the table

0:00
Double Data Logo

Product matching makes or breaks your data

0:00
Double Data Logo

Top products must be available at 7 PM

0:00
Double Data Logo

Top products matter across every grocery platform

0:00
Double Data Logo
Business impact

Benchmark local fulfillment power to dominate neighborhood convenience.

Understand exactly how hard competitors are pushing their logistics networks. Turn geographic ETA insights into targeted operational expansions and smarter localized marketing.

Seize new local zones
Identify specific neighborhoods where competitor delivery promises lag behind actual network density. Deploy localized marketing to capture frustrated customers waiting too long for their groceries.
Win the speed narrative
Pinpoint exact delivery radii where your dark stores structurally outperform rival fulfillment times. Accelerate customer acquisition by confidently advertising faster service within those districts.
Optimize fleet plotting
Compare your advertised fulfillment windows against local competitor benchmarks for equal distances. Refine dispatch models to ensure your logistics network is not overcommitting resources needlessly.
Speak to an Analyst
→ Request free PoC
How it works

From geographic coordinates to competitive logistics insights.

We systematically map delivery promises against physical infrastructure. This ensures your operations team always understands local fulfillment baselines across the market.

1

Extract

Our systems track advertised ETAs across localized delivery zones without requiring login credentials. We capture public baseline promises from Getir, Flink, and Wolt Market to establish expected neighborhood speeds.
2

Correlate

We align those public delivery estimates with our continuously updated database of competitor dark store coordinates. This maps out how aggressively operators promise fulfillment per kilometer of real distance.
3

Deliver

The processed geographic intelligence flows directly into your operational tools via REST API or custom Power BI dashboards. Strategy teams instantly review network performance metrics to guide regional expansion.
FAQ

Questions we get from operations leaders like you

Honest answers about how we track geographic delivery metrics without crossing compliance lines.

Ready to map your competitive advantage?

Request a sample dataset showing ETA performance metrics across your most competitive neighborhoods. Our data specialists will provide a custom extract tailored to your primary operating city, completely free of commitment.

  • A dedicated data expert assigned to your case
  • No obligation, free consultation
  • Full support from scoping to delivery

Need an NDA first? Just mention it in the form - we're happy to sign.

Logo

Get access to the only

market intelligence you need

© 2026 doubledata.com | All Rights Reserved

Made by mush studio