Coverage Mapping for
Restaurant Chain Leaders

Operations teams struggle to visualize exactly where their franchises lose reach compared to regional rivals. Coverage Mapping delivers a clear overlay of your true delivery boundaries against competitors, allowing you to close gaps before they cost you orders.

Trusted by Fortune 500.

Get real-time data from all restaurant chains.

Without this data

Your team operates blind to shifting delivery boundaries

Franchise operators have no objective view of their actual delivery radiuses across different aggregator networks. This geographical fragmentation allows nearby competitors to capture entire neighborhoods simply by maintaining wider platform coverage.

Strategic
Real estate planning relies on guesswork
Network expansion strategies are built on theoretical drive times rather than actual platform boundaries. You risk placing new sites in overlapping zones while leaving high-demand neighborhoods completely unserved.
Operational
Analysts manually plot mapping tool radii
Regional managers spend hours cross-referencing individual store addresses against platform polygons just to verify active service areas. This slow process delays necessary adjustments when platforms unexpectedly shrink delivery perimeters.
Business
Market share bleeds to aggressive rivals
Competitors operating from overlapping locations swallow available order volume by maintaining superior geographic availability. Unnoticed zone shrinkage translates directly into lost daily gross merchandise value.
Intelligence
Executives lack unified regional reporting
Board-level visibility into true market penetration remains fragmented across disparate provincial spreadsheets. Strategic decisions regarding platform partnerships stall because leadership cannot confidently assess nationwide footprint.
Sample signal

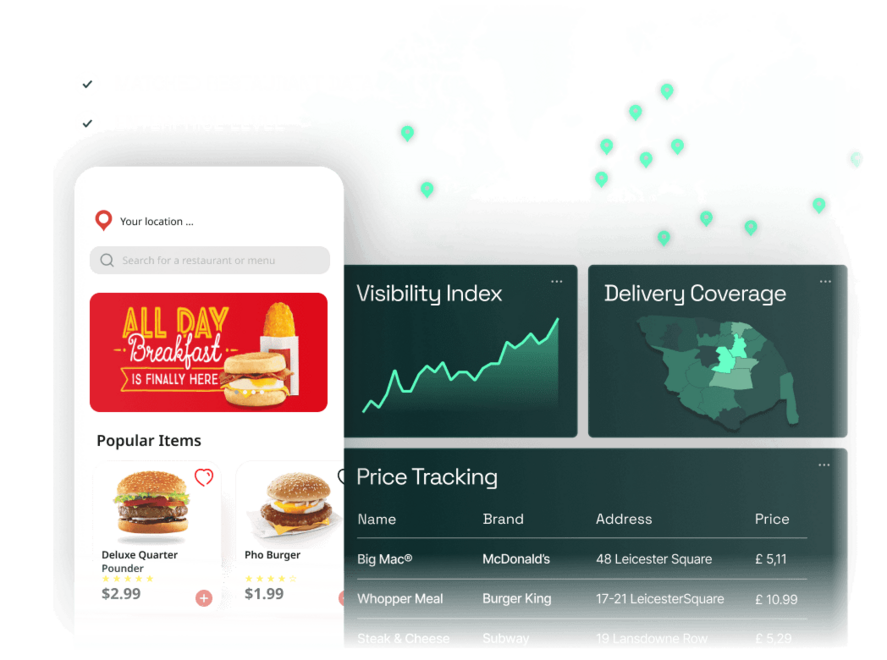
What a coverage mapping record looks like

A precise geographical overlay detailing exact street-level delivery boundaries for a specific store location. You immediately see where your service ends and where competitor availability begins.

Store Location Aggregator Zone Polygon ID Coverage Health Boundary Status Last Snapshot
KFC - Brixton Deliveroo LDN-BX-441 3.8 / 5 Shrinkage today 09:15
Burger King - Camden Uber Eats UE-CAM-89 4.9 / 5 Active today 11:42
Nando's - Soho Just Eat JE-SOHO-02 4.1 / 5 Overlap Risk yesterday
Five Guys - Islington Deliveroo LDN-IS-90 4.7 / 5 Expanded 2 days ago
Pizza Express - Victoria Uber Eats UE-VIC-77 3.6 / 5 Restricted today 10:05
Speak to an Analyst
→ Request free PoC
What you get

Your team gains precise neighborhood-level visibility

Interactive mapping overlays actual service perimeters across every major platform for your entire restaurant network. This spatial intelligence transforms vague availability questions into sharp operational directives.

12 brands
Brands monitored
View exact polygon boundaries for major rivals overlaid directly against your own service parameters.
4 platforms
Networks tracked
Compare true delivery footprints across multiple aggregator networks to spot platform discrepancies.
<24h
Update frequency
Track structural shifts in geographical availability daily to ensure consistent neighborhood access.
Street level
Mapping accuracy
Identify overlapping zones and unserved areas down to specific postal codes for precise resolution.

How client teams use our data to win the market

0:00
Double Data Logo

Test our data before you commit to a full partnership

0:00
Double Data Logo

Make decisions backed by data, not guesswork

0:00
Double Data Logo

High-volume data in-house? It’s not that simple

0:00
Double Data Logo

AI can’t match high-volume enterprise needs

0:00
Double Data Logo
Business impact

Transform geographical gaps into tangible revenue capture

Stop ceding high-value delivery zones to aggressive rivals. Precise spatial data allows operations leaders to maximize revenue potential from existing real estate investments.

Seize unserved territories
Spot lucrative neighborhoods where competitors lack service capabilities. You can rapidly target these exact postal codes with localized marketing.
Optimize platform presence
Identify locations where certain aggregators restrict your operational radius. You can negotiate better geographic terms using hard coverage metrics.
Expand daily market reach
Pinpoint exact boundary lines to resolve franchise overlap disputes. Clear mapping ensures every location maximizes its addressable customer base.
Speak to an Analyst
→ Request free PoC
How it works

From raw geographic signals to mapped intelligence in 3 steps

We continuously map availability networks across major delivery channels and translate complex spatial data into usable business logic.

1

Extract

Our infrastructure regularly queries geographical perimeters from Uber Eats, Deliveroo, and Just Eat across target cities. We capture precisely where major chains like KFC and Burger King are available to order.
2

Normalize

Raw polygon data and radius configurations differ wildly between various delivery networks and proprietary systems. We standardize these diverse coordinate sets into a single cohesive geographical framework.
3

Deliver

The formatted spatial intelligence flows directly into your preferred BI environments like Tableau or Power BI. Strategy teams immediately access clean visualization layers comparing their reach against the broader market.
FAQ

Questions we field from QSR operations leaders

Straight answers about how we map delivery boundaries and handle location data at scale.

Map your true market coverage today

Request a customized sample mapping your top five locations against key regional competitors. Our intelligence team will review your specific spatial requirements with zero obligation.

  • A dedicated data expert assigned to your case
  • No obligation, free consultation
  • Full support from scoping to delivery

Need an NDA first? Just mention it in the form - we're happy to sign.

Logo

Get access to the only

market intelligence you need

© 2026 doubledata.com | All Rights Reserved

Made by mush studio