Multi-Platform Presence Analysis for
Restaurant Chain Leaders

Multi-Platform Presence Analysis maps exact delivery boundaries and ranking positions across every third-party marketplace. Operations teams can spot coverage gaps and identify exactly where competitors are winning customers.

Trusted by Fortune 500.

Get real-time data from all restaurant chains.

Without this data

Your team operates with incomplete geographical and commercial context

Without accurate footprint tracking, restaurant chains surrender entire neighborhoods to rival operators. Teams struggle to maintain consistent brand representation across multiple delivery marketplaces.

Strategic
Franchise territory overlaps
Network expansion decisions rely on static maps rather than dynamic delivery radii. This leads to cannibalization between your own sites and leaves lucrative zip codes completely unserved.
Operational
Manual boundary verifications
Field managers spend hours each week manually typing addresses to confirm store delivery limits. Address-by-address spot-checking drains resources and still fails to catch sudden radius shifts.
Business
Unnoticed ranking declines
Locations fall out of the top ten during crucial dinner hours without triggering any alerts. This silent drop in app placement immediately stifles order volume and damages same-store sales.
Intelligence
Fragmented marketplace reporting
Digital leaders wait days for aggregated performance summaries from disconnected third-party portals. The executive board receives backward-looking metrics instead of actionable neighborhood insights.
Sample signal

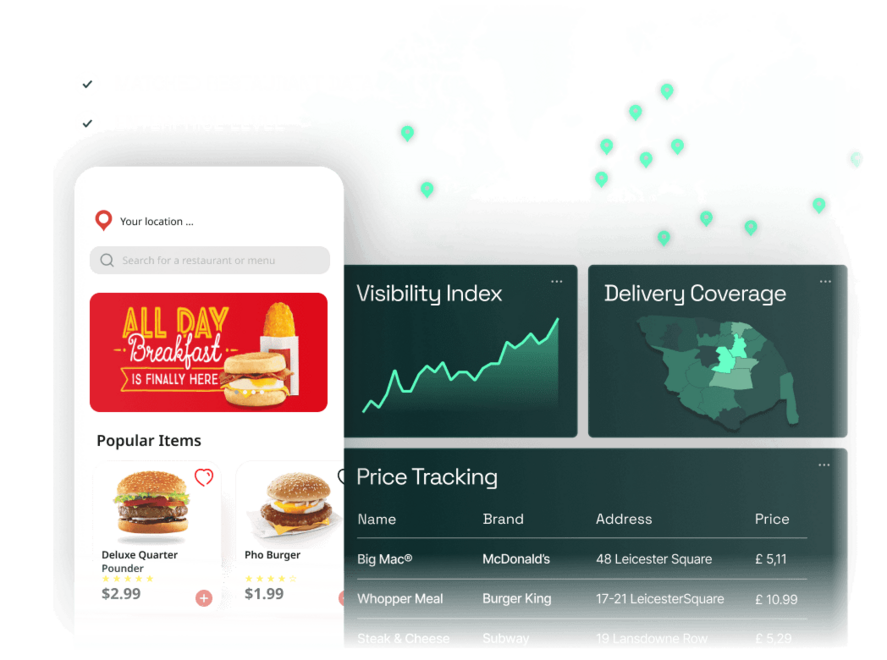
What a presence analysis record looks like

Every record captures real-time neighborhood availability, app ranking position, and advertised delivery fees. This provides immediate clarity on exactly how your location appears to customers compared to nearby rivals.

Restaurant Location Marketplace Category Rank Delivery Radius Avg Rating Presence Status Last Checked
McDonald's - 160 Broadway Uber Eats #3 2.0 mi 4.6 / 5 Top Placement today 12:45
Domino's - 85th St & 2nd Ave DoorDash #18 1.5 mi 3.9 / 5 Radius Shift today 13:10
Five Guys - 296 Bleecker St Deliveroo #1 3.5 mi 4.8 / 5 Dominant today 14:05
Wendy's - Queens Blvd Grubhub #25 4.0 mi 3.6 / 5 Rank Drop yesterday
Shake Shack - Madison Sq Uber Eats #5 2.5 mi 4.7 / 5 Active 2 days ago
Speak to an Analyst
→ Request free PoC
What you get

Your team secures unified marketplace intelligence

FoodDataLab delivers precise geographical boundaries and ranking data via interactive dashboards or REST API. Operations leaders can track exactly how their real estate performs digitally.

15+
Major platforms
Monitor exact store availability and search ranking positions across all third-party apps.
400+
Tracked markets
Track precise neighborhood coverage boundaries for thousands of local franchise locations.
1hr
Refresh cadence
Receive hourly updates on critical search placement shifts during peak lunch and dinner hours.
98%
Coverage mapped
Compare precise delivery area overlaps against rival quick service operators in every market.

How client teams use our data to win the market

0:00
Double Data Logo

Test our data before you commit to a full partnership

0:00
Double Data Logo

Make decisions backed by data, not guesswork

0:00
Double Data Logo

High-volume data in-house? It’s not that simple

0:00
Double Data Logo

AI can’t match high-volume enterprise needs

0:00
Double Data Logo
Business impact

Turn digital geography into revenue growth

Precise marketplace visibility data translates directly into higher order volumes and stronger local dominance. Teams act on real-time coverage gaps to expand their digital footprint.

Capture unserved zones
Identify profitable neighborhoods where competitors lack delivery coverage. Operations teams can immediately adjust store fulfillment radii to seize these localized volume opportunities.
Win peak hour rankings
Detect when your top performing locations drop out of the primary carousel. Marketing managers launch targeted promotional counter-campaigns to regain top placement before dinner rushes.
Optimize platform fees
Compare advertised delivery costs against local rivals across different marketplaces. Franchises adjust their threshold structures to ensure their final offering remains highly competitive.
Speak to an Analyst
→ Request free PoC
How it works

From scattered locations to centralized intelligence

We continuously extract public marketplace footprints and consolidate them into structured datasets. Your operations leaders receive clean, actionable intelligence tailored to your specific trade zones.

1

Extract

Our systems continuously pull location data and advertised service radii from Uber Eats, Deliveroo, and DoorDash. We map the digital boundaries of every operational storefront without requiring any platform authentication.
2

Normalize

We match disparate store listings across multiple platforms to a single physical address. This process aligns chaotic marketplace identifiers into a clean hierarchy of restaurant locations and corresponding delivery zones.
3

Deliver

The refined geographical intelligence flows directly into your corporate Power BI environment or arrives via REST API. Field leaders access daily reports detailing exact coverage metrics and search placement changes.
FAQ

Questions we get from operations leaders

Real questions from franchise directors and digital heads evaluating our marketplace presence data.

See your true digital footprint

Request a sample map showing your actual delivery coverage alongside key competitors in your primary market. Our analysts will configure a preliminary view tailored to your specific brand footprint.

  • A dedicated data expert assigned to your case
  • No obligation, free consultation
  • Full support from scoping to delivery

Need an NDA first? Just mention it in the form - we're happy to sign.

Logo

Get access to the only

market intelligence you need

© 2026 doubledata.com | All Rights Reserved

Made by mush studio